
Polymarket Volume Hits $4B Weekly: Signals for Crypto Prediction Markets in 2026
See how Polymarket's record $4B weekly volume is shifting crypto prediction markets and what traders should watch in real-time odds.
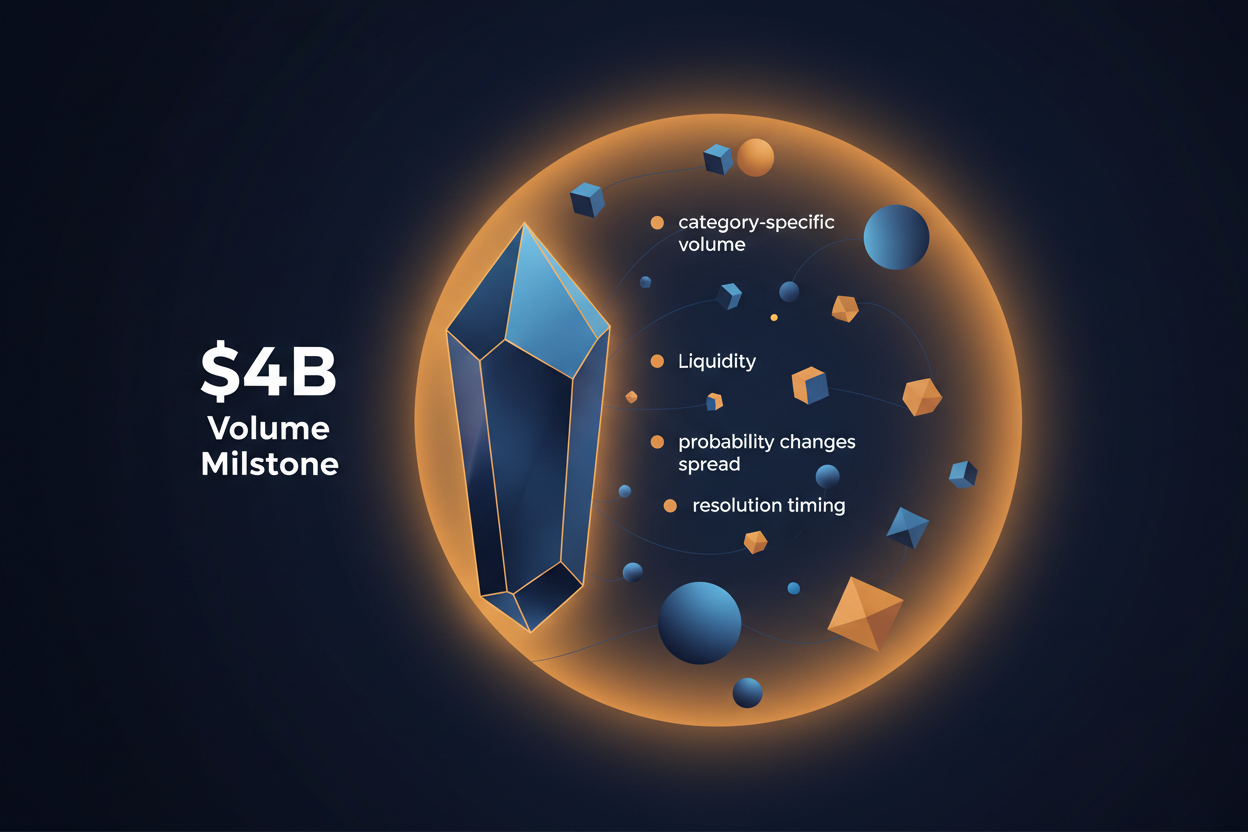
Polymarket weekly volume crossed $4 billion in July 2026, a twenty-fold increase from roughly $200 million a year earlier, raising fresh questions about how volume and odds function as signals inside crypto prediction markets.
July 2026 Volume Milestone: What the Numbers Actually Show
Bank of America Global Research reported that combined weekly volume across Polymarket’s US and international platforms rose from about $200 million a year earlier to more than $4 billion in July 2026. The figure covers activity on both the global platform and the separate US entity, according to the Yahoo Finance summary of the research. This twenty-fold jump marks a clear expansion in overall activity during that specific month.
The same report ties the surge to July conditions rather than later periods. Platform homepages display live rolling figures that update continuously, so a single weekly snapshot from July does not automatically translate to current levels.
Volume observations from one period provide a snapshot of activity during that time. Revisiting the same sources at regular intervals allows any apparent trend to be confirmed or revised with the most recent primary data.
Crypto Prediction Markets Volume Compared with Broader Platform Totals
Polymarket’s 2026 year-to-date volume through September 29 reached $71.7 billion across both platforms, while the US entity alone accounted for $21.0 billion, according to DeFiRate data. These totals include every category rather than isolating crypto prediction markets. Sports, politics, and crypto together made up 90 percent of volume since July 2024, per CryptoNews reporting.
Sports alone represented 45 percent of daily volume in one Arkham Intelligence comparison. That concentration shows why headline platform numbers do not directly reveal activity levels inside crypto contracts. Category-level breakdowns become necessary before volume can serve as a reliable signal for any single segment.
Crypto prediction markets therefore sit inside a larger mix. Traders who want to isolate crypto-specific liquidity must filter the broader totals rather than rely on the combined figure. The 2026 year-to-date split between the global and US platforms further illustrates that regulatory boundaries affect where volume lands. When participants examine these splits, they can better judge whether observed price movements in crypto-linked contracts arise from dedicated interest or simply spill over from heavier activity in adjacent categories.
Beyond Volume: Liquidity, Spreads, and Resolution Timing as Real Signals
- Liquidity describes the ease of entering or exiting a position at a quoted price without moving the market. In a short-duration crypto up/down market that settles in hours, thin order books can produce large price swings on modest trade sizes, so depth on each side of the book matters more than total platform turnover. Depth provides a clearer picture of whether a quoted probability can actually be acted upon at scale.
- Spreads measure the gap between the highest bid and lowest ask. Wide spreads inflate the apparent size of any probability shift because a small order can push the displayed odds farther than the same order would move in a tight market. Narrower spreads, by contrast, allow traders to interpret changes as more representative of collective sentiment rather than mechanical friction.
- Time-to-resolution determines how much new information can still arrive before settlement. Contracts that resolve in days leave less room for later corrections, so an early odds move carries different weight than the same move in a contract that runs for weeks. Longer horizons give participants repeated opportunities to reassess and adjust positions as fresh data emerges.
These elements together determine whether an observed probability change reflects genuine information or simply the mechanics of a thin book. Paying attention to them in sequence helps readers place any single data point in proper context.
Polymarket Versus Kalshi: Volume, Regulation, and Market Coverage Differences
A September 2026 report placed 30-day rolling volume at $3.1 billion for Polymarket and $14.1 billion for Kalshi, according to Bitcoin.com. Combined lifetime volume for both platforms exceeded $150 billion by May 2026, per Yahoo Finance. These snapshots capture different windows and cannot be read as permanent rankings.
| Venue | 30-day Rolling Volume (Sep 2026) | Combined Lifetime Volume (May 2026) | Source |
|---|---|---|---|
| Polymarket | US$3.1 billion | . | Bitcoin.com |
| Kalshi | US$14.1 billion | . | Bitcoin.com |
| Both | . | >US$150 billion | Yahoo Finance |
The comparison reveals that venue-specific windows can invert relative standings even after an earlier weekly peak at one platform. Regulatory status and market coverage also differ: Polymarket operates as a crypto-native global venue while Kalshi functions under U.S. Event-contract rules, which affects eligible contracts and settlement processes. Because each venue’s rules shape the types of contracts available and the speed of final resolution, traders benefit from aligning their analysis with the specific venue whose structure matches the question they are trying to answer.
How to Read Probability Moves Without Over-Interpreting
Polymarket International equity-linked volume exceeded $220 million across roughly 31,000 markets between October 2025 and early September 2026, according to Finance Magnates. That expansion beyond core categories shows how probability shifts can appear in many contract types.
Before treating any move as informative, check three data points. First, confirm liquidity depth at the prevailing price so the shift does not reflect a single large order. Second, review recent volume within that specific category rather than platform-wide totals. Third, note time to resolution, because short-duration crypto markets allow repeated trading on small probability changes that later reverse.
These steps separate signal from noise when equity-linked or crypto contracts move quickly. Applying them consistently turns raw probability changes into more durable insights that can be compared across different market conditions and contract durations.
What Remains Uncertain About 2026 Prediction Market Data
September 2026 weekly totals and exact market-share rankings still require primary-source confirmation. Secondary reports cite different platform aggregates, and only a limited set of authoritative primary documents appears across available sources. The largest reported Polymarket US monthly volume reached $5.0 billion in July 2026, while Polymarket International volume hit $9 billion in April and the US entity recorded $1.3 billion that same month.
Volume figures alone do not predict future trading conditions or outcomes. Conflicting secondary totals underscore the need for direct verification before any September record can be asserted with confidence. Maintaining a habit of cross-checking multiple independent sources therefore remains the most practical way to keep assessments grounded as new data arrives.
The $4 billion July milestone marks real growth in crypto prediction markets, yet traders gain more from monitoring category-specific liquidity, spreads, and probability context than from platform-wide totals alone. Use the checklist above to evaluate each signal on its own evidence.