Polymarket Statistics: User Trade Frequency Log-Normal Decay and Volume Peaks Exposed
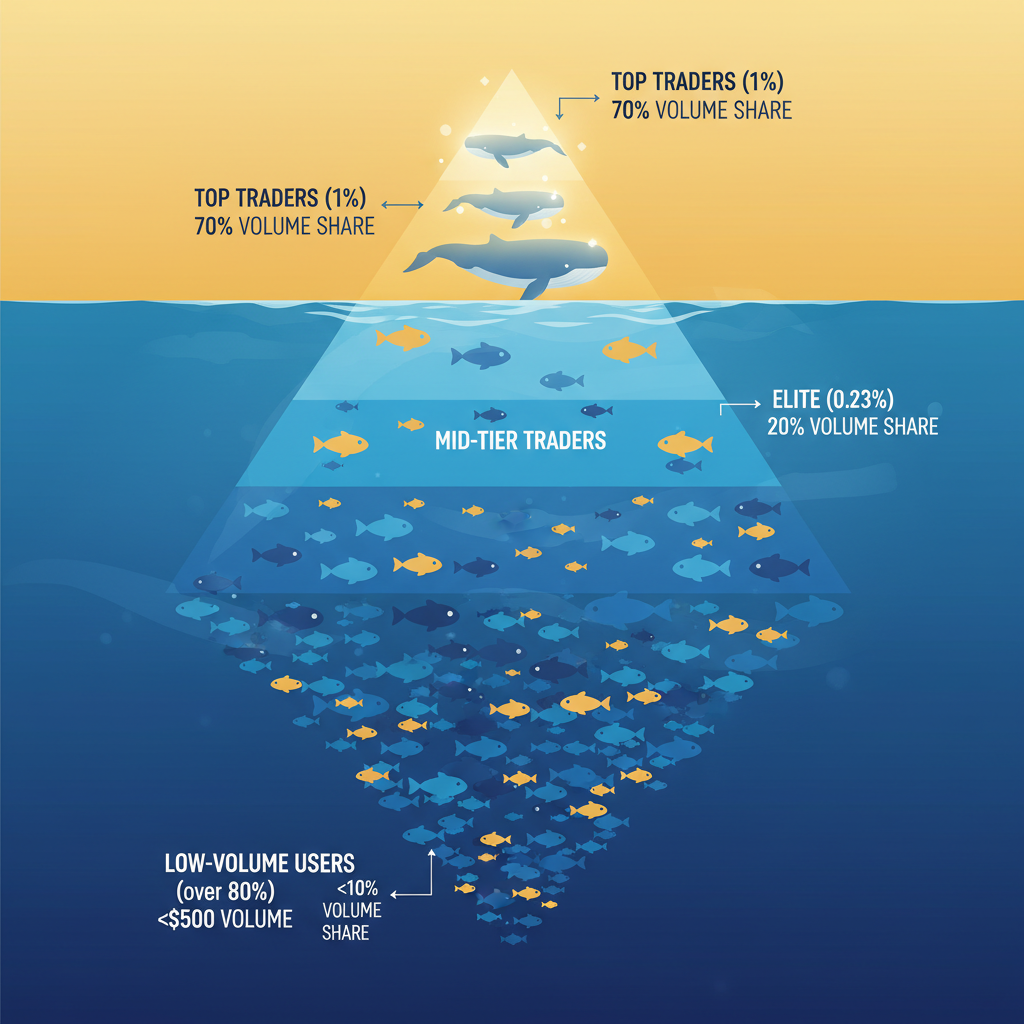
Polymarket statistics paint a clear picture of concentrated action. A tiny group of top users handles the bulk of trading volume, recent reports peg it at around 70% from the top 1%. Trade frequency drops off in a classic log-normal decay: most folks make just a few trades, while a handful go all out. This setup funnels volume into bigger bets, showing how a core of dedicated traders really moves the needle on Polymarket.
Stick with me, and you'll get a solid grip on Polymarket data, unpack prediction market insights on user trends and signals, and pick up strategies to catch those high-impact spots or dodge risks in these fast-moving markets.
What Do Polymarket Statistics Say About User Activity?
Polymarket's crowd splits into haves and have-nots For engagement. Back in 2024, your typical user wrapped up about 15 trades total. Daily numbers tell another tale, though. Platforms clocked average daily trades around 200,000 in late 2024. The real action comes from active users, who cranked out roughly 25 trades a day.
That's a huge gap. Most people, 80% or so, keep trades under $500 a pop. Frequency falls off fast: casuals trade now and then, outliers pile on volume that swamps everyone else. One analysis put the top sliver of wallets, say, 0.2%, at over 60% of total volume.
These splits scream inequality. Weekend warriors pop in and out. Power users keep the liquidity flowing. That volume-to-open interest ratio hovering near 0.7? It shows trades flipping faster than positions stick around. For anyone digging into Polymarket trends, this is your starting line. Know the divide, and you can guess how big news will light up the heavy hitters.
How Does Log-Normal Decay Show Up in User Trade Frequency?
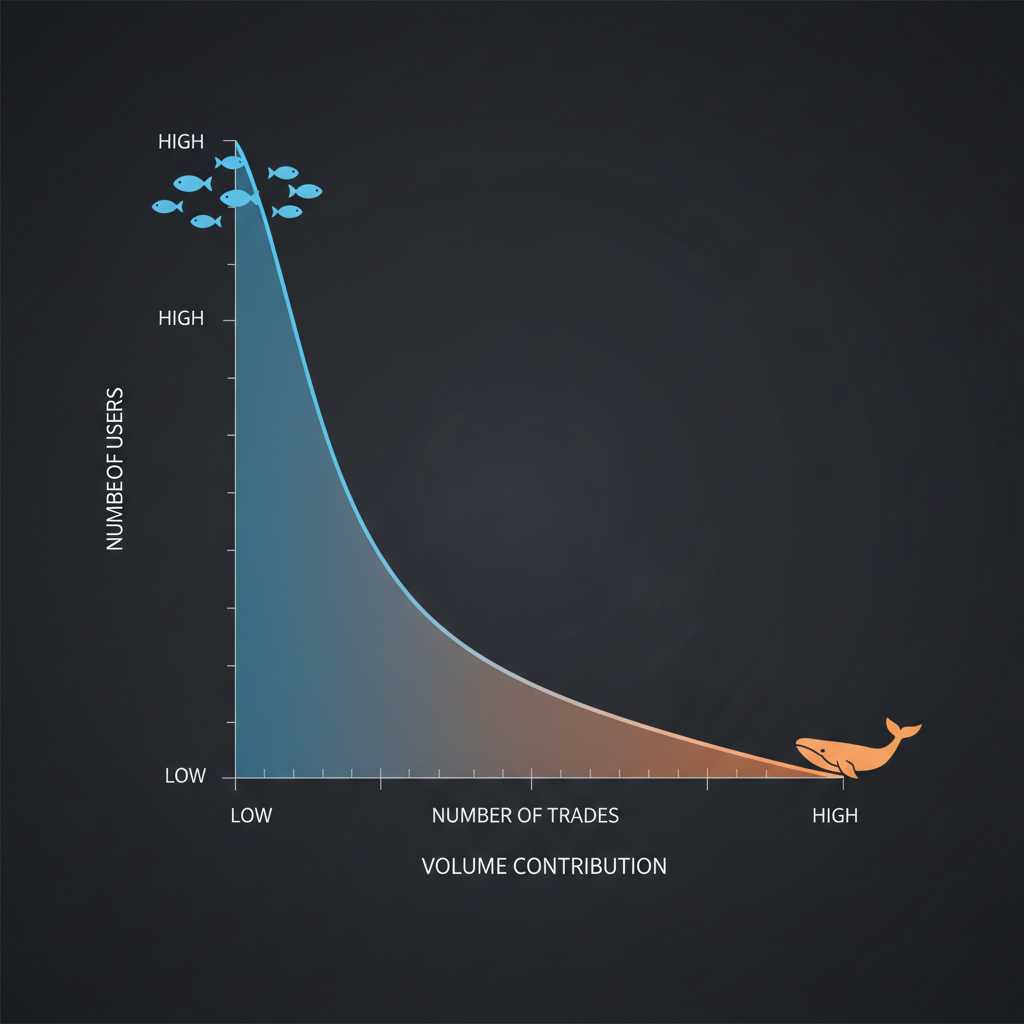
Financial data loves skewed curves, tons of small moves, a few massive ones. Polymarket user trade frequency nails that log-normal decay pattern. Most traders? A handful of bets. Then a sharp drop as you climb to the pros who trade nonstop.
Imagine the graph: fat cluster at low trade counts for most users, making up the biggest chunk of people. But their impact? Tiny. The long tail, those high-frequency folks, grabs 15% or so of total volume.
Why care? It spotlights the imbalance. Whales steer the ship, leaving casuals with spotty liquidity off-peak. Flip it to your edge: watch for surges in fast trades. They often hint at coming swings. Cut through the quiet majority's noise, zero in on the active tail, that's where Polymarket signals hide.
Polymarket Data: Where Volume Peaks and Users Stack Up
Volume bunches up by user type. Over 80% stick to sub-$500 trades, so the real juice comes from bigger players. High-frequency action claims about 15% of volume, usually from bots or obsessives.
Segment it. Minnows pack the base, lots of users, little splash. Whales up top? That narrow peak drives 60%+ of volume. Top 1%? Easily 70%. They spike during hot events like elections or crypto calls.
Time it right. Late 2024 averaged 200,000 trades daily, exploding on news. Actives held steady at 25 a day. The 0.7-ish volume ratio screams short-term flips over long holds.
Pattern spotters eat this up. Histogram charts make the decay pop: heavy left, skinny tail packing the punch. Tier your watchlist by wallet size. Jump in when whales ramp up.
High-Volume Traders: The Pulse of Polymarket Trends
Big traders set the rhythm. Top 1% own 70% of volume; the elite 0.2% slice hits 60%+. They sharpen prices, squeeze spreads in chaos.
Traits? Constant action, 25 trades daily for actives. High-stakes focus. But even they bleed: reports say 70% of addresses end in the red. Tough game.
Real talk: whale rushes on volume pops often kick off trends. Fast trades at 15% signal bets or setups. Caveat, 25% might be wash trading, faking depth.
Markets lean their way. Track clusters on-chain. Mimic smart, sidestep traps. Ride their waves, don't drown.
Think about elections. Whales pile in early, odds shift. Or crypto pumps, their volume confirms or fakes it. Spot the decay in frequency, and you read the room.
Prediction Market Insights: Polymarket Echoes Wall Street
Polymarket apes traditional finance on whale power. Stocks? Institutions run the show. Same here: top dogs dominate.
Twists make it fresh. Event bets, polls, launches, over boring balance sheets. Users average 15 trades yearly, not decade holds. Daily 200k peaks on headlines, not steady grind.
TradFi tricks transfer. Liquidity watch? Check. Speculative churn at 0.7 ratio? Yup. Wash noise? Like HFT debates.
Familiar, but electric. Slap stock volume reads on prediction odds. Events rule, whales everywhere.
Deeper: retail floods memes, pros own substance. Polymarket data mirrors that, minnow hype fades, tail endures.
Top Polymarket Signals Every Trader Needs
Volume Spikes from Fast Trades
High-frequency hits 15% of volume. When it tops 200k daily averages, whales might be loading up. That's your buy cue.
Whale Warnings
Top sliver swings prices hard, 60%+ volume. But 70% lose overall. Spread bets into minnow zones (80% under $500) for balance.
Active Core Tracking
Dune boards or labels flag the 25-trades-a-day crew. Follow them.
Ratio Red Flags
Volume-to-open interest near 0.7? Overtrading alert.
Wash Traps
Up to 25% fake volume. Verify on-chain.
These turn Polymarket statistics into your playbook. Log-normal decay filters chaff from wheat.
Bottom line: Polymarket runs on elite skew and peak bursts. Grab your own data dive today. Trade sharper tomorrow. What signal will you chase first?